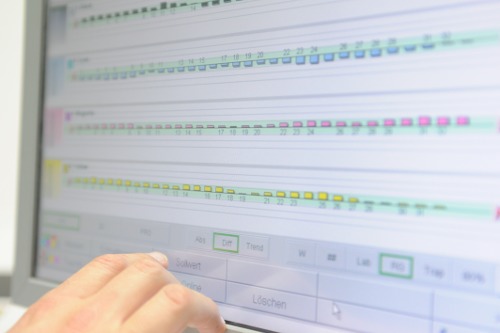
Display of Measured Values
Once the job is created, the measurement can be started. There are various possibilities to display the results. The most Dataview with measured values used variant is the zonal, inking unit related display of the density respectively color deviation. There are also displays for dot gain curves, Lab graphics and more available.
If the automatic control is activated, after evere measurement a correction is sent to the press console. This can be checked by the operator and confirmed after it. To calculate the correction standard densities (same density for each zone), reference sheets or a mixture of both may be used.
All results will be logged. The log consists of every single measurement with date, time, shhet counter, used reference (reference sheet or standard density), comment and a statistic analysis for the whole run. The "LithoScan Professional" quality log is usable for an internal quality management or to forward it to customers.
Measurement data and teachins are handled as ASCII files. This guarantees well defined interfaces via floppy disk, USB or network to other departments in your facilities.